Category Archives: Business Planning

Lean Plan and the Business Model Canvas

Early this month I tweeted out my recent post on business planning as dashboard and GPS.

//platform.twitter.com/widgets.js

Which prompted this response, from Antony Upward:

Which I liked, and answered, in my own twitter fashion:

He answered encouraging a blog post on it. Which, as it turns out, is this post today. So I’ll ping him when this comes out.

I did summarize the idea in the tweet above. Lean business planning is good for all businesses, and all business owners. The business model canvas is a nice framework for startups to summarize and plan how they intend to make money. It’s excellent for what it does, but isn’t the same as a business plan, because – as I said above – planning means not just that but also milestones, metrics, and essential business numbers.

This is not my original idea. In a way, my colleague here at Palo Alto Software, Noah Parsons, beat me on this one by several years, with his post on plans: A new way to develop and present your business model. He points out the similarities between the business model canvas and the LivePlan strategic summary page, called a pitch page. The pitch page, which is built into LivePlan, draws out the same essential information. We also have a free one-page strategy template that matches the LivePlan pitch that you can download today.

Which goes fairly well into my sidebar-like-comment in the dashboard-and-GPS post:

And if you happen to be a LivePlan user, it gets even better: use the pitch page for strategy and tactics, the schedule for milestones, the built-in financial projections, and link back to your accounting for automatic plan vs. actual. Then you have lean business planning to optimize your business.

Bottom line here? The nugget? Keep your plan lean, yes, but don’t neglect business planning for steering your business and developing execution, focus, and accountability. Use our free one-page strategy template, the LivePlan pitch page, the business model canvas, or simple bullet points to define key points of strategy and tactics. Whatever works for you is fine. But, in whichever case you choose, please add milestones, metrics, and projections of sales, spending, and cash flow. And then, when you’re done with the first plan, recognize that it’s obsolete in a few weeks at most and needs to be reviewed regularly and revised as needed.

Business Plan Software Then and Now

I was shocked, over the weekend, to discover that it’s been more than 10 years since I posted The Future of Business Planning Software here on this blog. I wrote then:

As time goes on, more people are going to use planning as process to manage their businesses better. More will see the power of regular plan review, regular plan-vs.-actual analysis, regular milestones management, and using it all to manage teams and priorities. As this happens it will improve the quality of business planning software as well as of business planning. We’ll all start to look at built-in plan-vs.-actual analysis, regular plan reviews, and software that makes that happen.

Future of Business Planning 2006Okay, so I’m an optimist. Instead of what I predicted (yeah, rose-colored glasses, I suppose), business planning is still, 10 years later, obscured by myth and misunderstanding. Experts who should know better are still advising people against business planning when what they mean is the wrong kind of business planning, the use-once-and-throw-away formal business plan full of painfully-perfected summaries and descriptions.

And what I said would happen was, definitely, what should have happened; and what should happen still. Better late than never. These things seem self evident to me:

  1. All business owners and startups have enormous benefits to gain from proper planning. Lately I’ve been writing about it as lean business planning, but it’s basically still today what has been fundamentally good planning for all of my lifetime. Short, concrete, specific, trackable, used for regular review and revision, part of a process that is heavy on plan vs. actual analysis.
  2. The ideal business plan, today, is smaller and more concentrated than the formal business plan we did in the Silicon Valley heydays of the 1980s. It’s a lot more lean.
  3. If those experts who say don’t do a business plan would say don’t do an old-fashioned formal complete business plan, just a lean plan, then they’d be right.
  4. Apply the general business rule of form follows function to business planning. Do only what you need. Do only what you’ll use. For business owners, you rarely a real business reason to do a full formal plan, but having a lean plan is golden, as long as you track it and use it to steer the business. Sometimes a bank will require a business plan, but usually a lean plan is good enough for that use too. Startups may need a business plan for investors who want to do due diligence on them before investing; that may or may not require more than a lean plan.

My most recent post on this, in the blog, is The Lean Business Plan as Dashboard and GPS. And there’s a category here called Lean Business Plan.

Will businesses finally pick up on this idea? I hope so. If you want to improve management and steer your business better, the right kind of business planning develops focus, priorities, accountability, and execution. And business plan software is going there already.

In regards to software, I’m happy to report that Palo Alto Software has made my 2006 predictions self-fulfilling prophecy. LivePlan connects to your QuickBooks or Xero accounting software and does plan vs. actual analysis automatically; plus this year vs. last year too.

10 Things Angel Investors Ask About Startups

Today the angel investment group I’m a member of (Willamette Angel Conference) finished our eighth year of choosing a startup to invest in. Our investment runs $100K to $500K, roughly. It’s announced every year on the second Thursday in May. The announcement comes later in the day, not here.

Our annual angel investors process

Every year we review 40 or so submissions from startups. We look at summaries, videos, financial projections, and pitches posted online at gust.com. We invite our favorites to pitch to us live in a series of meetings. We assign due diligence teams to read their business plans thoroughly, check documents, talk to customers, test products, look at their legal situations, and so on. And eventually we choose a winner (or two or three).

My personal list of 10 things I want to know

Push PinDuring the process, we’ve had to review again what we want to know from startups as we review them. What information is essential? With that in mind, I wrote up my own list of what I look for in startups, from the outset. This is what I want a startup to tell me from the beginning.

  1. The startup team’s background, experience, and credibility. Specifically, what experience do you have with startups. Have you run a startup? Have you been an employee or team member of a startup? And of course your education, degrees, schools, etc. And your work experience. That goes for founder or founders, and main team members. If you don’t have a complete team, have you identified the key skills you need and candidates to hire? Are they likely to come on board? What are their backgrounds, skills, and experience? Who will do the administration, production, marketing, and sales?
  2. What problem do you solve, and how? I want to understand the needs and wants so I can decide for myself on product-market fit. What kinds of people or organizations have that problem, and how badly do they need or want what you are going to sell? For that you have to give me the whys and the background, the stories, not just the numbers; but numbers are good.
  3. And why you? Why are you more qualified than anybody else. How can you keep others from jumping in on your business if it’s successful?
  4. And who else? Who else is doing what you are, or solving what you solve? How do they do it?
  5. Key Metrics. What traction do you have so far? How long have you been up and running, and how many customers or subscribers or sales or visits or downloads or conversions or leads and inquiries? What are your metrics so far? Where do you see them going.
  6. Milestones met and milestones to come. I want to see both what you’ve done and what you plan to do. Your valuation today is about what you’ve accomplished already. What you plan to accomplish gives me an idea of possible future valuations.
  7. How much money are you raising and what are you spending it on. Investment should be used to finance deficit spending that’s going to generate a lot of growth and increased valuations. If you can relate your financial ask to milestones you plan to meet, then that’s great.
  8. Strategy. Strategy is focus. What markets, what products, what specific attributes of your business make this focus realistic? What markets and solutions are you ruling out, or leaving for later?
  9. Tactics. Tactics are essentials like pricing, channels, online, social, marketing, sales, financial plans.
  10. Essential projections. Sales forecast built from bottoms-up assumptions, spending budget, projected P&L, balance, and cash flow. I’m annoyed if you don’t provide these, but I should add that I’m also not going to eliminate a startup for bad financials. Bad financials are the easiest problem to fix.

I should note that I do care a lot about exit strategies, and even more so about the intention to exit. But I assume the intention is there when you seek angel investment. And I want to go from your product and solution to your market, your competition, and my guess about future exits. Exits happen 3-5 years from now. I want you to focus on your business, and I’ll decide whether I believe you’ll eventually become an attractive acquisition so we can get an exit.

Also, on financials, I look for understanding the relationship between spending and growth, how much you need spend in the main spending categories, in broad brush, to be able to grow. I expect growth to cost a lot of money and almost always rule out profits. If you were going to be profitable, you wouldn’t need investment, and you wouldn’t offer a great ROI. I don’t hold you accountable for accurately projecting your essential  numbers, but I do expect you to understand the assumptions and the drivers that you use to develop the forecasts.

And, a third point: We usually get this information several ways, starting with the summaries our startups post on gust.com. There are summaries, slides, videos, and financials. I do always want to see a business plan, but I don’t care about all the text summaries and descriptions. I do want the business plan to include strategy, tactics, metrics, milestones, and essential business numbers.

Business Owners: The Lean Business Plan as Dashboard and GPS

What if you own a business, you’re not a startup, you don’t have to generate a traditional business plan to show to a bank or an investor? Would you still want a business plan? Yes, emphatically, yes you do …

  • … but it’s not a traditional business plan. It’s a lean plan. 
  • … and you don’t really want a plan. You want planning. You want planning for your business like you want navigation for your journey, with destination, route, and real-time dashboard information to make changes easily, and optimize. 

The lean business plan: 

Lean Business Planning

So the lean business plan is simple, just bullet points and lists and tables. It’s easy to do. It doesn’t include the summaries and descriptions of a traditional business plan because its for you, the business owner to use. It’s not for outsiders. It’s not an academic exercise. It doesn’t have to prover your market. It doesn’t need a carefully composed executive summary. You don’t sweat the editing or formatting because this lean plan isn’t a document; it’s just a plan.

Of course it includes essential business numbers. We all know, as business owners, the value of forecasting sales, budgeting expenses, and planning our cash flow.

And if you happen to be a LivePlan user, it gets even better: use the pitch page for strategy and tactics, the schedule for milestones, the built-in financial projections, and link back to your accounting for automatic plan vs. actual. Then you have lean business planning to optimize your business.

Recurring Lean Business Plan Cycle

Notice please the plan-run-review-revise cycle in the diagram, also shown here on the right. That’s where you see how planning works for real businesses, as dashboard and navigation. You keep a lean plan fresh with regular review and revision. Steering is course correction, and so in planning. You lay out strategy, tactics, milestones, and projections, not to show them to outsiders, but to define expectations so you can track results and make changes as required when results are different from expectations (and they will be … you might check out business plans are always wrong, but vital). You have your strategy and tactics in bullets, your key performance indicators, milestones you’re working towards, and financial projections; and then you have tracking and regular review, and course corrections.

Planning done right as dashboard and GPS

We lived through the real use of business planning at Palo Alto Software in 2008 when the great recession hit and our sales tumbled. We had a plan and we had plan vs. actual results, so as sales declined, we were easily able to find the connections between sales and discretionary marketing expenses, so we could temporarily cut expenses without cutting any employees. That was much better because we don’t like to lose employees who know us and like us and are doing well.

The change in that case didn’t make our business plan null and void. It made it more valuable.

Business Plan Financials? Why Bother?

As I’m winding up my series of posts on standard business plan financials  – this is the 20th since last month – I want to focus on why? Why bother to project your business plan financials ahead of time? Aren’t they going to be wrong anyhow? Aren’t they going to change? Some people will suggest that you don’t both with this part of planning. And that’s terrible advice.

For your own business, whether you have to show anybody else a business plan, or not, simple financial projections, done right, are a powerful tool for managing your business better. They give you a way to lay out in an orderly manner how you expect your sales, cash, spending, and capital to go, based on the meaningful assumptions for your business, whatever they are. Obviously what drives your business numbers depends on the exact nature of your business. For some it’s web traffic, downloads, or subscriptions; for others it’s store traffic, or leads, or pipeline, or unique visitors; you know what it is for your business. And furthermore, if you’re one one of those businesses that is using a business plan to show investors for due diligence, or as part of a bank loan application. I like nowy Martin Zwillig explains the use of business plan financials in a post for the gust.com blog:

Why? For you to make decisions and manage the business – because we are all mere mortals and can’t possibly keep all these numbers and calculations in our head – to decide whether and when the business is going to be profitable given rational projections of costs and income (these assumptions are referred to as your business model). Secondarily, it will be required by potential investors to validate how much money you need to get started, and how much return they can expect on their investment.

And for me, in my experience, it all comes alive with the plan-vs.-actual analysis. I say often business plans are always wrong, but also vital, and extremely necessary. Of course they’re wrong because we’re human so we can’t predict the future. But they’re vital because you track the direction and the details of what went differently, and you manage that as steering. When sales are better than projected, you figure out why, what’s working, and put more resources into it. When sales are worse than planned, you have your assumptions laid out so you can identify what went wrong and adjust. Did marketing programs not work, or did you not execute? Tracking the money will help you know. How do I have to cut to stay solvent? Having projections is vital.

Business Plan Financials

I also advocate – strongly – taking the extra time to learn what a business owner needs to know about financials to make those projections match standard practices. I insist that the basic standard definitions are not that hard to learn (it’s all in this post), and keeping your projections in line with standards makes them instantly recognizable to people who expect standard financials. Fine points like timing, working capital absorbed in inventory and accounts receivable, and funding assets re critical to actual real cash flow in the real world. So you don’t just guess at standards, you follow them.

And here – in that illustration above – is a cool and intriguing benefit of doing the business plan financials right. When you have proper financial projections, you work in a delightfully closed system that helps you pull it all together. If you have the right conceptual linkages between sales, costs, expenses, profits, assets, liabilities, and capital, then your projected balance will balance and you will be both financially and mathematically correct. And that’s makes the whole projection effort easier and more interesting. Just as one example, for more than 20 years now, at Palo Alto Software we’ve used collection days (how many days, on average, you wait to get paid by your business customers) as an input variable to help solve the math for cash in the bank, which is a number we derive from the inputs. And it has to be right, because we’re using algebra in the background (of course it’s only as right as your assumptions, but that’s where plan vs. actual comes in; and the balance will always balance.)


Business Plan Financials: Starting Costs

It’s really important to have an idea of what you need before you start. Continuing with my series on standard business plan financials, startups need to project starting costs. Starting costs set up a starting balance, which is necessary to plan cash flow. And the starting costs are critical to determining whether a startup can bootstrap or needs outside funding. For existing companies that already have financial results, projections start with the expected ending balance of the previous period. But for startups, it’s about starting costs.

Starting costs are essentially the sum of two kinds of spending. You can estimate them both in two simple lists:

  • Startup expenses: These are expenses that happen before the beginning of the plan, before the first month of operations. For example, many new companies incur expenses for legal work, logo design, brochures, site selection and improvements, and signage. If there is a business location, then normally the startup pays rent for a month or more before opening. And if employees start receiving compensation before the opening, then those disbursements are also startup expenses.
  • Startup assets: Typical startup assets are cash (the money in the bank when the company starts), business or plant equipment, office furniture, vehicles, and starting inventory for stores or manufacturers.

A Simple Starting Costs Example

I’ve used a bicycle store as an example in several posts that are part of this series of standard business plan financials. Here’s a visual in spreadsheet form, of sample starting costs for a hypothetical bicycle store.

Sample Starting Costs

Notice that the lists for estimating starting costs, on the left in the illustration above, are matched to another list of starting funding, on the right side of the illustration. Books have to balance, so the initial estimates need to include not just the money you spend, but also where it comes from. In the case above, Garrett had to find $124,500, and you can see that he financed it with Accounts Payable, debt, and investment in various categories.

Another Simple Starting Costs Example

Here is another simple example: the starting costs worksheet that Magda developed for the restaurant I used for a sample sales forecast. Magda’s list includes rent and payroll, the same as in her monthly spending, but here they are included in starting costs because these expenses happen before the launch.

Sample Starting Costs


I included rent and payroll because they point out the importance in timing. The difference between these as startup expenses and running expenses is timing, and nothing else. Magda could have chosen to plan startup expenses as a running worksheet on expenses, starting a few months before launch, as in the illustration below. The launch in this case is early January, so the expenses for October through December are startup expenses. I prefer the separate lists, because I like the way the two lists create an estimate of starting costs. But that’s an option.

Alternate Starting Expenses

The LivePlan Alternative

If you’re a LivePlan user, the LivePlan interface assumes this method and has a more intuitive interface than the spreadsheet version I’m showing in this post. For LivePlan, you start your plan when you start spending, regardless of launch date. So the spending you do for rent and salaries and such, before launch, is part of the flow, as above. Also, LivePlan has its own guided way of helping you figure out what assets you need, how much they cost, and how you are going to finance starting costs, to set up your balance. And the LivePlan cash flow estimator will help you decide how much cash you need, so you don’t have to follow the spreadsheet method here (below).

How to Estimate Your Starting Costs

Obviously the goal with starting costs isn’t just to track them, but to estimate them ahead of time so you have a better idea, before you start a new business, of what the financial costs might be. Breaking the items down into a practical list makes the educated guess a lot easier. Ideally, you know the business you want to start, you are already familiar with the industry, so you can do a useful estimate for most of the startup costs from your own experience. If you don’t have enough firsthand knowledge, then you should be talking to people who do. For others, such as insurance, legal costs, or graphic design for logos, call some providers or brokers, and talk to partners; educate those guesses.

Starting Cash is the Hardest and Most Important

How much cash do you need in the bank, as you launch? That’s usually the toughest starting cost question. It’s also prone to misinformation, such as those alleged rules of thumb you can find everywhere, saying you need to have a year’s worth of expenses, or six months’ worth, before you start. It’s not that simple. For most businesses, the startup cash isn’t a matter of what’s ideal, or what some expert says is the rule of thumb – it’s how much money you have, can get, and are willing to risk.

The best way is to do a Projected Cash Flow while leaving the supposed starting cash balance at zero, which shows how much (at least in theory, according to assumptions) the startup really needs in cash to support the business as it grows, before it reaches a monthly cash flow break-even point. Magda did that to determine the $12,000 needed as starting cash for her restaurant. Note how, in the illustration here, the lowest point in cash is slightly less than $12,000:

Estimating Startup Cash


That low point comes, theoretically, in the third month of the business, March. The low point is $11,609. Obviously that’s just an educated guess, but it’s based on assumptions for sales forecast, expense budget, and important cash flow factors including sales on account and purchasing inventory. So it’s better than a stab in the dark, or some rule of thumb. Just as an example, the total spending with the estimates shown here, the theoretical “year’s worth of spending,” is $182,000 (which you don’t see on the illustration, by the way, but take my word for it). The total for the first six months is $93,000. If Magda sticks to those old formulas, she can’t start the business. She is able to raise enough money, between loans and her savings, to put $12,000 into the starting cash balance. So that’s what she does. Then she launches and continues to have her monthly reviews, and watch the performance of all key indicators very carefully.


Standard Financials: Sample Website Sales Forecast

Here’s fourth sales forecast example, part of my standard business plan financials series, following email sales forecast example, restaurant sales forecast example, and how to forecast sales last week. This is a sample website sales forecast. In all of them I’m making the point that sales forecasts come from meaningful assumptions you can use to manage the plan vs. actual analysis later, so you can track, review, and revise your plan as part of ongoing management. While there is a natural temptation to avoid the sales forecast because you can’t predict the future, the goal is to define assumptions you can track and manage.

This final example lays out a sample website sales forecast. We don’t just guess; we develop bottoms-up forecasts based on assumptions. We base it on some sales drivers that we can predict, and, to some extent control — or at least track and revise. We can look at these in detail below.

Sample Website Sales Forecast

First, estimate the drivers for web traffic

Clearly the web business sales assumptions depend on web traffic. In the first two rows of the forecast, we project reasonable numbers of web visits based on past web experience, search engine optimization (SEO), links that we can predict. In this case we break them into two categories:

  • First, website visits from organic search, based on the site, its contents, the SEO, and so forth. This projection may be optimistic because getting 200 people per month at the outset isn’t as easy as writing numbers into a spreadsheet. It takes marketing. Still, it’s an assumption we can track.
  • Second, website visits from social media. This assumes active engagement, posts, links, and updates on Facebook, Twitter, and other social media sites.

More about the pay-per-click assumptions

As you can see in the bottom two rows of the forecast, pay per click web traffic depends on two factors: how much you spend on pay-perclick advertising, and how much you pay for each click. A click in this case means somebody who was browsing on some other website, or who did a web search for some specific search word or phrase, clicked a link that went to your website. If you are not familiar with this kind of online marketing, there’s a good summary in Wikipedia under “pay per click”.

I base my assumptions here on bid-based pay-per-click systems, such as what Google uses. As you set up the campaign, you use a system where you bid for how much you’ll pay for each click you get from the paid area of search results when a web search requests a specific keyword. For example, the illustration here shows what happened when I searched for the term “restaurant in Eugene OR.” Two businesses have paid for the ad placement at the top. One is a restaurant supply business, the other a yellow-pages index. If I clicked on either one, I would go to that website and the business would be charged the pay per click amount. The rest of the search results are Google’s favorites, based on Google search algorithms, as the most useful.

Conversion Rate and Projected Sales

The row labeled “Website conversion rate” holds the very important assumption for the percentage of website visitors who choose to buy the product. That assumption is half a percent (0.5%) for the first month, increasing to six tenths of a percent (0.6%) in the second month. The total unit sales estimate in “Total unit sales” comes from multiplying the conversion rate in “Website conversion rate” by the estimated web traffic in the row labeled “Total website visits.” So, for example, the projected  13 units for January is one half of one percent of the estimated 2,550 web visits.

Standard Business Plan Financials: Email Sales Forecast Example

Here’s another sales forecast example, part of my standard business plan financials series, following my restaurant sales forecast example posted here yesterday, and how to forecast sales the day before. The point is to call out realistic assumptions that make a sales forecast useful. This is to illustrate my underlying point that anybody who can run a business can forecast sales; and that the goal isn’t to accurately predict the future – which is, of course, impossible – but rather to lay out trackable assumptions that you can follow up and manage. Your real results will be different. If your sales forecast is done right, the difference between what you projected and what actually happened will be the key to ongoing management.

What I’d like to show you here is how when you want to forecasting something new you start with assumptions you can lay out, and then go on from there. That’s what Magda does in my previous post, going from restaurant layout with chairs and tables, to times of day, and days per week. This next example projects unit sales from email marketing. Here again, the key is to track the assumptions. So here’s a sample sales forecast for the projected unit sales of the first few months of a product to be marketed via email. [Warning: This is really simplified. May the email marketing experts forgive me for making it look this simple. It isn’t; but the basic numbers follow these basic principles.]

  1. It starts of course with how many emails get sent. The assumption here is that the marketing department sends out 20,000 emails the first month, 25,000 the next month, and so forth. And let’s remember that while it’s easy to type numbers into a spreadsheet, execution requires an effective email message, design and formatting, and a good list of email addresses of real prospects. Targeting is essential.
  2. We put assumptions for how many people open the emails into the second row. And the assumption shown for January, by the way, is amazingly high, and quite unrealistic. A business would have to be sending emails to a list of opted-in email addresses for customers or prospects who like this sender a lot. Available information on average emails opened, from MailChimp and other vendors of email services, runs more like 15% to 25%. The numbers here are high.
  3. We use the third row for our assumption for how many people click the link on the email. There too, this example is very optimistic. Normal rates rarely get above 2%.
  4. Next is website views. With emails sent, emails opened as a percentage, and clicks as a percentage, we can project how many people click an email link and arrive at a website. In January, for example, we take 20000*.35*.08 = 560. Here again, the math is simple. The business behind it — a good email list, a good email, subject line, text, and links, and offering — is not simple.
  5. Then we project a conversion rate, which is how many people who see the offer on the web choose to buy. The 0.5% (one half of one percent) assumption here is not unusually low. Actual conversion rates depend on how well targeted the people are who arrive at the website, how attractive the offer is, and many other marketing and sales variables.
  6. Finally, in the last row, we arrive at projected sales. The indication here is that sending 20,000 emails produces the small unit sales shown here in the bottom row.

From here we would take the unit sales resulting from these assumptions to the main sales  forecast, with the structure we use for the sample sales forecast above: units, prices, sales, direct costs per unit, and direct costs. The spreadsheets would look a lot like the ones for Magda, in my previous post; and Garrett the bicycle retailer in How to Forecast Sales.

Standard Business Plan Financials: Sales Forecast Example

Continuing my series on standard business plan financials, this is an example of a startup sales forecast. It’s a direct follow-up to yesterday’s How to Forecast Sales. The goal is to take a hypothetical case and open up the thinking involved, not so anybody just copies it, but rather to serve as an example. The underlying goal is to open up the idea that forecasting isn’t a technical feat; it’s something that anybody can do.

We had Garrett the bike store owner yesterday. Today it’s Magda, who wants to open up a new café in an office park. She wants a small locale, just six tables of four. She wants to serve coffee and lunches. She hasn’t contracted the locale yet, but she has a good idea of where she wants to locate it and what size she wants, so she wants to estimate realistic sales. She assumes a certain size and location and develops a base forecast to get started.

Establishing a base case

She starts with understanding her capacity. She does some simple math. She estimates that with six tables of four people each, she can do only about 24 sit-down lunches in an average day, because lunch is just a single hour. And then she adds to-go lunches, which she estimates will be about double the table lunches, so 48 per day. She estimates lunch beverages as .9 beverages for every lunch at the tables, and only .5 beverages for every to-go lunch. Then she calculates the coffee capacity as a maximum of one customer every two minutes, or 30 customers per hour; and she estimates how she expects the flow during the morning hours, with a maximum 30 coffees during the 8-9 a.m. hour. She also estimates some coffees at lunch, based on 3 coffees for every 10 lunches. You can see the results here, as a quick worksheet for calculations.

Restaurant Sales Forecast Assumptions


Where do those estimates come from? How does Magda know? Ideally, she knows because she has experience. She’s familiar with the café business as a former worker, owner, or close connection. Or perhaps she has a partner, spouse, friend, or even a consultant who can make educated guesses. And it helps to break the estimates down into smaller pieces, as you can see Magda has done here.

And, by the way, there is a lesson there about estimating and educated guesses: Magda calculates 97 coffees per day. That’s really 100. Always round your educated guesses. Exact numbers give a false sense of certainty.

Café monthly assumptions

She then estimates monthly capacity. You saw in Illustration 7-2 that she estimates 22 workdays per month, and multiplies coffees, lunches, and beverages, to generate the estimated unit numbers for a baseline sample month.

So that means the base case is about 1,500 lunches, about 1,000 beverages, and about 2,000 coffees in a month. Before she takes the next step, Magda adds up some numbers to see whether she should just abandon her idea. At $10 per lunch and $2 per coffee or beverage, that’s roughly $15,000 in lunches, $2,000 in lunch beverages, and $4,000 in coffees in a month. She probably calls that $20,000 as a rough estimate of a true full capacity. She could figure on a few thousand in rent, a few thousand in salaries, and then decide that she should continue planning, from the quick view, like it could be a viable business (And that, by the way, in a single paragraph, is a break-even analysis).

From base case to sales forecast

With those rough numbers established as capacity, and some logic for what drives sales, and how the new business might gear up, Magda then does a quick calculation of how she might realistically expect sales to go, compared to capacity, during her first year.

Estimating monthly sales

Month-by-month estimates for the first year

Month-by-month estimates for the first year

All of which brings us to a realistic sales forecast for Magda’s café in the office park (with some monthly columns removed for visibility’s sake). This is a spreadsheet view, so, if you’re a LivePlan user, all you need is to figure the assumptions and the software will do the calculations and arrangement.

Cafe Sales Forecast

Notice that Magda is being realistic. Although her capacity looks like about $20,000 of sales per month, she knows it will take a while to build the customer base and get the business up to that level. She starts out at only about half of what she calculated as full sales; and she gets closer to full sales towards the end of the first year, when her projected sales are more than $19,000.

Important: these are all just rough numbers, for general calculations. There is nothing exact about these estimates. Don’t be fooled by how exact they appear.

Notice how she’s working with educated guessing. She isn’t turning to some magic information source to find out what her sales will be. She doesn’t assume there is some magic “right answer.” She isn’t using quadratic equations and she doesn’t need an advanced degree in calculus. She does need to have some sense of what to realistically expect. Ideally she’s worked in a restaurant or knows somebody who has, so she has some reasonable information to draw on.

Estimating direct costs

We’ve seen direct costs already, in the previous section. They are also called COGS, or cost of goods sold, or unit costs. In Magda’s case, her direct costs or COGS are what she pays for the coffee beans, beverages, bread, meat, potatoes, and other ingredients in the food she serves.

Just as with the sales categories, forecast your direct costs in categories that match your chart of accounts.

So, with her unit sales estimates already there, Magda needs only add estimated direct costs per unit to finish the forecast. The math is as simple as it was for the sales, multiplying her estimated units times her per unit direct cost. Then it adds the rows and the columns appropriately.

Restaurant Sales Forecast COGS


Here again you see the idea of educated guessing, estimates, and summary. Magda doesn’t break down all the possibilities for lunches into details, differentiating the steak sandwich from the veggie sandwich, and everything in between; that level of detail is unmanageable in a forecast. She estimates the overall average direct cost. Coffees cost an average of 40 cents per coffee, and lunches about $5.00. She estimates because she’s familiar with the business. And if she weren’t familiar with the business, she’d  find a partner who is, or do a lot more research.

Standard Business Plan Financials: How to Forecast Sales

Line ChartContinuing with my series on standard business plan financials, you can’t run a business, or start a new business, without a sales forecast. Whether you have a full business plan, or a lean business plan, or just a collection of spreadsheets, a proper sales forecast ought to become like a dashboard, meaning it’s a tool you use to check plan vs. actual results, see problems developing, and correct your day-to-day with the progress of your sales. Sales of some number mean nothing without the context the sales forecast gives you. For example, $100 isn’t good or bad on it’s own; but it’s bad if you expected $150, and good if you expected $50. The expectations make it real.

Real Goals of Sales Forecast

Your sales forecast won’t accurately predict the future. We know that from the start. What you want is to understand the sales drivers and interdependencies, to connect the dots, so that as you review plan vs. actual results every month, you can easily make course corrections.

Sure, people shy from doing forecasts, because it can feel like real numbers and you can think only the numbers people can do it. Don’t believe that. You don’t have to have an MBA degree or be a CPA. You don’t need sophisticated financial models or spreadsheets. I was a vice president of a market research firm for several years, doing expensive forecasts, and I saw many times that there’s nothing better than the educated guess of somebody who knows the business well. All those sophisticated techniques depend on data from the past. And the past, by itself, isn’t the best predictor of the future. You are. So let’s look at how to forecast sales, step by step.

If you think sales forecasting is hard, try running a business without a forecast. That’s much harder.
Your sales forecast is also the backbone of your business plan. People measure a business and its growth by sales, and your sales forecast sets the standard for expenses, profits and growth. The sales forecast is almost always going to be the first set of numbers you’ll track for plan vs. actual use, even if you do no other numbers.

If nothing else, just forecast your sales, track plan vs. actual results, and make corrections; that’s already business planning.

Match Your Forecast to Your Accounting

It should be obvious: Make sure the way you organize the sales forecast in rows or items or groups matches the way your accounting (or bookkeeping) tracks them.

Match your chart of accounts, which is what accountants call your list of items that show up in your financial statements.

If the accounting divides sales into meals, drinks, and other, then the business plan should divide sales into meals, drinks, and other. So if your chart of accounts divides sales by product or service groups, keep those groups intact in your sales forecast. If bookkeeping tracks sales by product, don’t forecast your sales by channel instead.

If you’re planning for a startup business, coordinate the bookkeeping categories with the forecasting categories.

Get your last Income Statement (also called Profit & Loss) and keep it in view while you develop your future projections.

If you don’t have more than 20 or so each rows of sales, costs, and expenses, then make the rows in the projected statement match the rows in the accounting.

If your accounting summarizes categories for you – most systems do – consider using the summary categories in your business plan. Accounting needs detail, while planning needs a summary.

If your categories in the projections don’t match the accounting output, you’re not going to be able to track plan vs. actual well. It will take retyping and recalculating. And you’ll lose the most valuable business benefit of business planning: management, steering your company.

The math is simple

Normally your sales forecast will group sales into a few manageable rows of sales and show projected units, prices, and sales monthly for the next 12 months and annually for the second and third years in the future. Here’s a quick example from a bicycle retailer named Garrett (with columns for April-November hidden on purpose, to make viewing easier):

Sample Sales Forecast

If you’re a LivePlan customer, don’t worry about this spreadsheet view, which is generic. LivePlan will guide you through the sales forecast assumptions and do the calculations automatically. For the generic spreadsheet option, shown here, you multiply units times prices to calculate sales. For example, unit sales of 36 new bicycles in March multiplied by $500 average revenue per bicycle means an estimated $18,000 of sales for new bicycles for that month.

Total Unit Sales is the sum of the projected units for each of the five categories of sales.

Total Sales is the sum of the projected sales for each of the five categories of sales.

Calculate Year 1 totals from the 12 month columns. Units and sales are sums of the 12 columns, and price is the average, calculated by dividing sales by units.

The numbers for Year 2 and Year 3 are just single columns; unless you have a special case, projecting monthly results for two and three years hence is overkill. It’s a problem of diminishing returns; you don’t get enough value to justify the time it takes. Other experts will disagree, by the way; and there may be special cases in which extended monthly projections are worth the effort.

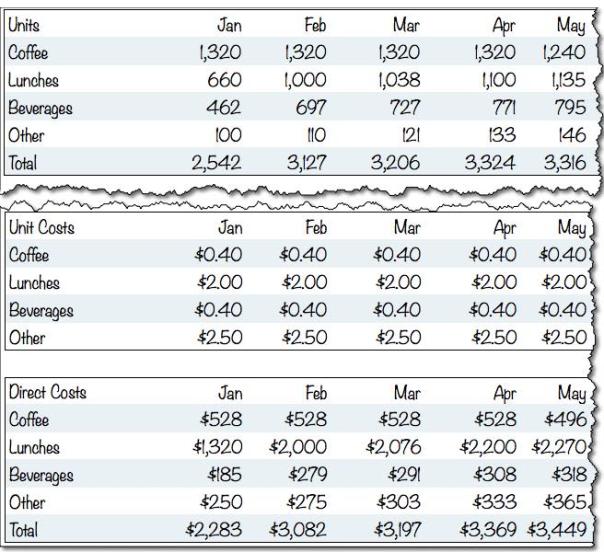
Estimate Direct Costs

A normal sales forecast includes units, price per unit, sales, direct cost per unit, and direct costs. Direct costs are also called COGS, cost of goods sold, and unit costs.

COGS stands for Cost of Goods Sold, and applies to businesses that sell goods. COGS for a manufacturer include raw materials and labor costs to manufacture or assemble finished goods. COGS for a bookstore include what the storeowner pays to buy books. COGS for Garrett are what he paid for the bicycles, accessories, and clothing he sold during the month. Direct costs are the same thing for a service business, the direct cost of delivering the service. So, for example, it’s the gasoline and maintenance costs of a taxi ride.

Direct costs are specific to the business. The direct costs of a bookstore are its COGS, what it pays to buy books from a distributor. The distributor’s direct costs are COGS, what it paid to get the books from the publishers. The direct costs of the book publisher include the cost of printing, binding, shipping, and author royalties. The direct costs of the author are very small, probably just printer paper and photocopying; unless the author is paying an editor, in which case what the editor was paid is part of the author’s direct costs.

The costs of manufacturing and assembly labor are always supposed to be included in COGS. And some professional service businesses will include the salaries of their professionals as direct costs. In that case, the accounting firm, law office, or consulting company records the salaries of some of their associates as direct costs.

The illustration below shows how Garrett uses estimated margins to project the direct costs for his bicycle store. For the highlighted estimates, the direct entry for bicycles unit cost is the product of multiplying the price by 68 percent. The total direct costs for bicycles in January are the result of multiplying 30 units by $340 per unit. And here again, LivePlan users don’t need to do these calculations; your software does it automatically.

Sample Direct Costs

Some Quick Notes About Standards

Timing Matters

Standard accounting and financial analysis have rules about sales and direct costs and timing. A sale is when the ownership of the goods changes hands, or the service is performed. That seems simple enough but what happens sometimes is people confuse promises with sales. In the bike store example, if a customer tells Garrett in May that he is definitely going to buy 5 bicycles in July, that transaction should not be part of sales for May. Garrett should put those 5 bicycles into his July forecast and then they will actually be recorded as sales in the bookkeeping actual sales in July when the transaction takes place. In a service business, when a client promises in November to start a monthly service in January, that is not a November sale.

Direct costs also happen when the goods change hands. Technically, according to accounting standards (called accrual accounting), when Garrett the bike storeowner buys a bicycle he wants to sell, the money he spent on it remains in inventory until he sells it. It goes from inventory to direct costs for the income statement in the month in which it was sold. If it is never sold, it never affects profit or loss, and remains an asset until some day when the accountants write off old never-sold obsolete inventory, at which time its lowered value becomes an expense. In that case it was never a direct cost.


Most of this has to do with proper accounting. My standard business plan financials series includes What’s Accrual Accounting and Why Do You Care, which is directly related. When in doubt, please read that one.


Gross Margin

Gross MarginOnce you have sales forecast and direct costs, you can calculate your estimated gross margin. Gross Margin is sales less direct costs. Gross Margin is a useful basis of comparison between different industries and between companies within the same industry. You can find guidelines and rules of thumb for different industries that give you an industry profile or average gross margin for different industries. For example, industry profiles will tell you that the average gross margin for retail sporting goods is 43%. Every business is different, but knowing the standards and averages gives you some useful comparisons.

The distinction isn’t always obvious. For example, manufacturing and assembly labor are supposed to be included in direct costs, but factory workers are paid sometimes when there is no job to work on. And some professional firms put lawyers’ accountants’ or consultants’ salaries into direct costs. These are judgment calls. When I was a young associate in a brand-name management consulting firm, I had to assign all of my 40 hour work week to specific consulting jobs for cost accounting.

Garrett can easily calculate the gross margin he’s projecting with his sales forecast. The illustration below shows his simple calculation of gross margin using his sales and direct costs.

How do I know what numbers to use?

But how do you know what numbers to put into your sales forecast? The math may be simple, yes, but this is predicting the future; and humans don’t do that well. Don’t try to guess the future accurately for months in advance. Instead, aim for making clear assumptions and understanding what drives sales, such as web traffic and conversions, in one example, or the direct sales pipeline and leads, in another. And you review results every month, and revise your forecast. Your educated guesses become more accurate over time.

Use experience and past results

  1. Experience in the field is a huge advantage. In the example above, Garrett the bike storeowner has ample experience with past sales. He doesn’t know accounting or technical forecasting, but he knows his bicycle store and the bicycle business. He’s aware of changes in the market, and his own store’s promotions, and other factors that business owners know. He’s comfortable making educated guesses. In another example that follows, the café startup entrepreneur makes guesses based on her experience as an employee.
  2. Use past results as a guide. Use results from the recent past if your business has them. Start a forecast by putting last year’s numbers into next year’s forecast, and then focus on what might be different this year from next. Do you have new opportunities that will make sales grow? New marketing activities, promotions? Then increase the forecast. New competition, and new problems? Nobody wants to forecast decreasing sales, but if that’s likely, you need to deal with it by cutting costs or changing your focus.
  3. Start with your best guess, and follow up. Update your forecast each month. Compare the actual results to the forecast. You will get better at forecasting. Your business will teach you.

How to Forecast a New Business or New Product

What? You say you can’t forecast because your business or product is new? Join the club. Lots of people start new businesses, or new groups or divisions or products or territories within existing businesses, and can’t turn to existing data to forecast the future.

Think of the weather experts doing a 10-day forecast. Of course they don’t know the future, but they have some relevant information and they have some experience in the field. They look at weather drivers such as high and low pressure areas, wind directions, cloud formations, storms gathering elsewhere. They consider past experience, so they know how these same factors have generally behaved in the past. And they make educated guesses. When they project a high of 85 and low of 55 tomorrow, those are educated guesses.

You do the same thing with your new business or new product forecast that the experts do with the weather. You can get what data is available on factors that drive your sales, equivalent to air pressure and wind speeds and cloud formations. For example:

  • To forecast sales for a new restaurant first draw a map of tables and chairs and then estimate how many meals per mealtime at capacity, and in the beginning. It’s not a random number; it’s a matter of how many people come in. So a restaurant that seats 36 people at a time might assume it can sell a maximum of 50 lunches when it is absolutely jammed, with some people eating early and some late for their lunch hours. And maybe that’s just 20 lunches per day the first month, then 25 the second month, and so on. Apply some reasonable assumption to a month, and you have some idea.
  • To forecast sales for a new mobile app, you might get data from the Apple and Android mobile app stores about average downloads for different apps. And a good web search might reveal some anecdotal evidence, blog posts and news stories perhaps, about the ramp-up of existing apps that were successful. Get those numbers and think about how your case might be different. And maybe you drive downloads with a website, so you can predict traffic on your website from past experience and then assume a percentage of web visitors who will download the app.
  • So you take the information related to what I’m calling sales drivers, and apply common sense to it, human judgment, and then make your educated guesses. As more information becomes available — like the first month’s sales, for example – you add that into the mix, and revise or not, depending on how well it matches your expectations. It’s not a one-time forecast that you have to live with as the months go by. It’s all part of the lean planning process.

Sales forecast depends on product/service and marketing

Never think of your sales forecast in a vacuum. It flows from the strategic action plans with their assumptions, milestones and metrics. Your marketing milestones affect your sales. Your business offering milestones affect your sales. When you change milestones — and you will, because all business plans change — you should change your sales forecast to match