Tag Archives: sales forecast

Standard Financials: Sample Website Sales Forecast

Here’s fourth sales forecast example, part of my standard business plan financials series, following email sales forecast example, restaurant sales forecast example, and how to forecast sales last week. This is a sample website sales forecast. In all of them I’m making the point that sales forecasts come from meaningful assumptions you can use to manage the plan vs. actual analysis later, so you can track, review, and revise your plan as part of ongoing management. While there is a natural temptation to avoid the sales forecast because you can’t predict the future, the goal is to define assumptions you can track and manage.

This final example lays out a sample website sales forecast. We don’t just guess; we develop bottoms-up forecasts based on assumptions. We base it on some sales drivers that we can predict, and, to some extent control — or at least track and revise. We can look at these in detail below.

Sample Website Sales Forecast

First, estimate the drivers for web traffic

Clearly the web business sales assumptions depend on web traffic. In the first two rows of the forecast, we project reasonable numbers of web visits based on past web experience, search engine optimization (SEO), links that we can predict. In this case we break them into two categories:

  • First, website visits from organic search, based on the site, its contents, the SEO, and so forth. This projection may be optimistic because getting 200 people per month at the outset isn’t as easy as writing numbers into a spreadsheet. It takes marketing. Still, it’s an assumption we can track.
  • Second, website visits from social media. This assumes active engagement, posts, links, and updates on Facebook, Twitter, and other social media sites.

More about the pay-per-click assumptions

As you can see in the bottom two rows of the forecast, pay per click web traffic depends on two factors: how much you spend on pay-perclick advertising, and how much you pay for each click. A click in this case means somebody who was browsing on some other website, or who did a web search for some specific search word or phrase, clicked a link that went to your website. If you are not familiar with this kind of online marketing, there’s a good summary in Wikipedia under “pay per click”.

I base my assumptions here on bid-based pay-per-click systems, such as what Google uses. As you set up the campaign, you use a system where you bid for how much you’ll pay for each click you get from the paid area of search results when a web search requests a specific keyword. For example, the illustration here shows what happened when I searched for the term “restaurant in Eugene OR.” Two businesses have paid for the ad placement at the top. One is a restaurant supply business, the other a yellow-pages index. If I clicked on either one, I would go to that website and the business would be charged the pay per click amount. The rest of the search results are Google’s favorites, based on Google search algorithms, as the most useful.

Conversion Rate and Projected Sales

The row labeled “Website conversion rate” holds the very important assumption for the percentage of website visitors who choose to buy the product. That assumption is half a percent (0.5%) for the first month, increasing to six tenths of a percent (0.6%) in the second month. The total unit sales estimate in “Total unit sales” comes from multiplying the conversion rate in “Website conversion rate” by the estimated web traffic in the row labeled “Total website visits.” So, for example, the projected  13 units for January is one half of one percent of the estimated 2,550 web visits.

Standard Business Plan Financials: Email Sales Forecast Example

Here’s another sales forecast example, part of my standard business plan financials series, following my restaurant sales forecast example posted here yesterday, and how to forecast sales the day before. The point is to call out realistic assumptions that make a sales forecast useful. This is to illustrate my underlying point that anybody who can run a business can forecast sales; and that the goal isn’t to accurately predict the future – which is, of course, impossible – but rather to lay out trackable assumptions that you can follow up and manage. Your real results will be different. If your sales forecast is done right, the difference between what you projected and what actually happened will be the key to ongoing management.

What I’d like to show you here is how when you want to forecasting something new you start with assumptions you can lay out, and then go on from there. That’s what Magda does in my previous post, going from restaurant layout with chairs and tables, to times of day, and days per week. This next example projects unit sales from email marketing. Here again, the key is to track the assumptions. So here’s a sample sales forecast for the projected unit sales of the first few months of a product to be marketed via email. [Warning: This is really simplified. May the email marketing experts forgive me for making it look this simple. It isn’t; but the basic numbers follow these basic principles.]

  1. It starts of course with how many emails get sent. The assumption here is that the marketing department sends out 20,000 emails the first month, 25,000 the next month, and so forth. And let’s remember that while it’s easy to type numbers into a spreadsheet, execution requires an effective email message, design and formatting, and a good list of email addresses of real prospects. Targeting is essential.
  2. We put assumptions for how many people open the emails into the second row. And the assumption shown for January, by the way, is amazingly high, and quite unrealistic. A business would have to be sending emails to a list of opted-in email addresses for customers or prospects who like this sender a lot. Available information on average emails opened, from MailChimp and other vendors of email services, runs more like 15% to 25%. The numbers here are high.
  3. We use the third row for our assumption for how many people click the link on the email. There too, this example is very optimistic. Normal rates rarely get above 2%.
  4. Next is website views. With emails sent, emails opened as a percentage, and clicks as a percentage, we can project how many people click an email link and arrive at a website. In January, for example, we take 20000*.35*.08 = 560. Here again, the math is simple. The business behind it — a good email list, a good email, subject line, text, and links, and offering — is not simple.
  5. Then we project a conversion rate, which is how many people who see the offer on the web choose to buy. The 0.5% (one half of one percent) assumption here is not unusually low. Actual conversion rates depend on how well targeted the people are who arrive at the website, how attractive the offer is, and many other marketing and sales variables.
  6. Finally, in the last row, we arrive at projected sales. The indication here is that sending 20,000 emails produces the small unit sales shown here in the bottom row.

From here we would take the unit sales resulting from these assumptions to the main sales  forecast, with the structure we use for the sample sales forecast above: units, prices, sales, direct costs per unit, and direct costs. The spreadsheets would look a lot like the ones for Magda, in my previous post; and Garrett the bicycle retailer in How to Forecast Sales.

Standard Business Plan Financials: Sales Forecast Example

Continuing my series on standard business plan financials, this is an example of a startup sales forecast. It’s a direct follow-up to yesterday’s How to Forecast Sales. The goal is to take a hypothetical case and open up the thinking involved, not so anybody just copies it, but rather to serve as an example. The underlying goal is to open up the idea that forecasting isn’t a technical feat; it’s something that anybody can do.

We had Garrett the bike store owner yesterday. Today it’s Magda, who wants to open up a new café in an office park. She wants a small locale, just six tables of four. She wants to serve coffee and lunches. She hasn’t contracted the locale yet, but she has a good idea of where she wants to locate it and what size she wants, so she wants to estimate realistic sales. She assumes a certain size and location and develops a base forecast to get started.

Establishing a base case

She starts with understanding her capacity. She does some simple math. She estimates that with six tables of four people each, she can do only about 24 sit-down lunches in an average day, because lunch is just a single hour. And then she adds to-go lunches, which she estimates will be about double the table lunches, so 48 per day. She estimates lunch beverages as .9 beverages for every lunch at the tables, and only .5 beverages for every to-go lunch. Then she calculates the coffee capacity as a maximum of one customer every two minutes, or 30 customers per hour; and she estimates how she expects the flow during the morning hours, with a maximum 30 coffees during the 8-9 a.m. hour. She also estimates some coffees at lunch, based on 3 coffees for every 10 lunches. You can see the results here, as a quick worksheet for calculations.

Restaurant Sales Forecast Assumptions


Where do those estimates come from? How does Magda know? Ideally, she knows because she has experience. She’s familiar with the café business as a former worker, owner, or close connection. Or perhaps she has a partner, spouse, friend, or even a consultant who can make educated guesses. And it helps to break the estimates down into smaller pieces, as you can see Magda has done here.

And, by the way, there is a lesson there about estimating and educated guesses: Magda calculates 97 coffees per day. That’s really 100. Always round your educated guesses. Exact numbers give a false sense of certainty.

Café monthly assumptions

She then estimates monthly capacity. You saw in Illustration 7-2 that she estimates 22 workdays per month, and multiplies coffees, lunches, and beverages, to generate the estimated unit numbers for a baseline sample month.

So that means the base case is about 1,500 lunches, about 1,000 beverages, and about 2,000 coffees in a month. Before she takes the next step, Magda adds up some numbers to see whether she should just abandon her idea. At $10 per lunch and $2 per coffee or beverage, that’s roughly $15,000 in lunches, $2,000 in lunch beverages, and $4,000 in coffees in a month. She probably calls that $20,000 as a rough estimate of a true full capacity. She could figure on a few thousand in rent, a few thousand in salaries, and then decide that she should continue planning, from the quick view, like it could be a viable business (And that, by the way, in a single paragraph, is a break-even analysis).

From base case to sales forecast

With those rough numbers established as capacity, and some logic for what drives sales, and how the new business might gear up, Magda then does a quick calculation of how she might realistically expect sales to go, compared to capacity, during her first year.

Estimating monthly sales

Month-by-month estimates for the first year

Month-by-month estimates for the first year

All of which brings us to a realistic sales forecast for Magda’s café in the office park (with some monthly columns removed for visibility’s sake). This is a spreadsheet view, so, if you’re a LivePlan user, all you need is to figure the assumptions and the software will do the calculations and arrangement.

Cafe Sales Forecast

Notice that Magda is being realistic. Although her capacity looks like about $20,000 of sales per month, she knows it will take a while to build the customer base and get the business up to that level. She starts out at only about half of what she calculated as full sales; and she gets closer to full sales towards the end of the first year, when her projected sales are more than $19,000.

Important: these are all just rough numbers, for general calculations. There is nothing exact about these estimates. Don’t be fooled by how exact they appear.

Notice how she’s working with educated guessing. She isn’t turning to some magic information source to find out what her sales will be. She doesn’t assume there is some magic “right answer.” She isn’t using quadratic equations and she doesn’t need an advanced degree in calculus. She does need to have some sense of what to realistically expect. Ideally she’s worked in a restaurant or knows somebody who has, so she has some reasonable information to draw on.

Estimating direct costs

We’ve seen direct costs already, in the previous section. They are also called COGS, or cost of goods sold, or unit costs. In Magda’s case, her direct costs or COGS are what she pays for the coffee beans, beverages, bread, meat, potatoes, and other ingredients in the food she serves.

Just as with the sales categories, forecast your direct costs in categories that match your chart of accounts.

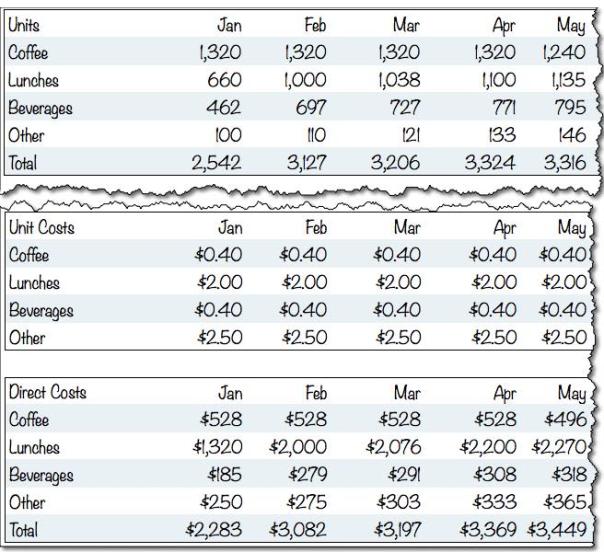
So, with her unit sales estimates already there, Magda needs only add estimated direct costs per unit to finish the forecast. The math is as simple as it was for the sales, multiplying her estimated units times her per unit direct cost. Then it adds the rows and the columns appropriately.

Restaurant Sales Forecast COGS


Here again you see the idea of educated guessing, estimates, and summary. Magda doesn’t break down all the possibilities for lunches into details, differentiating the steak sandwich from the veggie sandwich, and everything in between; that level of detail is unmanageable in a forecast. She estimates the overall average direct cost. Coffees cost an average of 40 cents per coffee, and lunches about $5.00. She estimates because she’s familiar with the business. And if she weren’t familiar with the business, she’d  find a partner who is, or do a lot more research.

How To Forecast Sales and Profits Without Just Guessing

Yes, it’s – my title here – a real question, and I get it a lot: how to forecast sales and profits without just guessing. It’s a good question too, because it leads to a better understanding of how and why we use forecasting to help manage a business, and to predict starting costs and the numbers for the first few months of a startup.

It’s a corollary to the question “but how can I forecast sales for a new product, when I have no data.”

And the key is that of course you guess. We’re people, we don’t know the future, so we are always guessing. But we’re not just guessing. We’re developing sets of assumptions. We’re looking at drivers for sales, realistic assumptions for expenses. We draw from experience as much as we can, and from research in addition. It’s a forecast, not a guess. And if it’s hard to forecast, sure; but it’s even harder to run a business well without a forecast.

Forecast Sales Based on Assumptions about Drivers

For example:

  • To forecast a web-based business you should probably consider traffic, drivers of traffic, plus conversion rates, and average unit sales per order. Drivers of traffic would include search engine optimization (SEO) for organic traffic, and pay-per-click (PPC) online marketing budget for paid traffic. Here is a simple example …
    i
  • If your marketing includes email marketing, you can break the sales down according to emails sent, percentage opened, clicks to the web from email, conversion rates, etc. The illustration here is a simplified example.
  • If you are forecasting sales of an actual physical product, going through retail stores, then you should take into account reasonable expectations for distributors, retail chain stores, number of stores carrying it over time, unit sales per store, etc. And you’d want to have a good understanding of how margins work as you sell your product to distributors and they sell to retail stores. And you should be able to estimate the related expenses, such as stocking fees, co-promotion fees, and administration costs.
  • If you are forecasting sales of a mobile app, you’d want to look at sales through each of the mobile app stores, and develop assumptions based on history of similar apps, adjusted for your promotion strategies, marketing expenses, etc.
  • If you are forecasting sales with a direct sales organization selling to larger companies, you should understand a direct sales sales force, reasonable expectations of leads, presentations, and closes per month per sales person, pipeline dynamics related to decision time, etc.

Forecast Expenses Based on Reasonable Expectations and Estimates

  • Estimates for expenses should include reasonable expectations on headcount, compensations per person, office space and logistics based on how many people and expected costs per square foot, infrastructure costs, and especially realistic marketing expenses.
  • Estimates of costs should take into account unit economics, economies of scale, production costs, etc.

These are just a few examples. Yes, it is guessing, but it’s also looking at drivers and assumptions and pulling the granular assumptions together so they are visible. And, furthermore, it’s supposed to be followed by regular plan vs. actual analysis, so the forecasts get steadily more accurate over time.

How Contagion Can Help You Forecast Sales

Can we talk about beauty in numbers? Amidst all the nervousness about forecasting new products, does it not make sense, and add elegance too, to talk about the classic s-curve we see in nature? So many natural phenomena show an increase along a natural S-curve and bell curve  like the two shown here on the right. Which, by the way, was done with Excel. And I’m going to explain it here and give you the formulas, so you can use them in your own sales forecasting. If you like this sort of thing.

Contagion_curve.jpg

What we see there is a natural projection of a good product — like cell phones or television or computers — spreading through a population of 50,000 people. It could be a new product technology that everybody ends up wanting, or, simply, a good idea. It doesn’t apply to a lot of new product forecasts without humans evaluating the results and tempering them with common sense. But then few mathematical models do.

The spreadsheet model that drew that line used these assumptions:

  1. The total population of potential users is 50,000
  2. At the start, 10 people are users
  3. Each month a new person starts using for every three people already using.

If you like math buzzwords, then you’ll like knowing that the math behind this natural curve is called a diffusion model, which has been used in science in applications like epidemiology (it’s basically the plot of the recent hit film contagion). It’s also closely related to the classic idea adaptation model, which produces a classic bell curve that we often see divided into areas for the opinion leaders, early adapters, and so forth.

Diffusion_bell_curve.jpg

That’s my second chart here, and it is done from exactly the same numbers as the first. The first is total users per month, and the second is new users per month. This one was made famous by sociologists studying the pattern of adaption of a new farming technique, and has been used a lot for predicting technology adaption.

This is one way to answer that frequently asked question “how do I forecast a new product when I have no history.”

In the spreadsheet model below, you can see the key formula for calculating new users from existing users. In cell D7 there you have the formula:

=(users*contagion rate) * (population-users)/population

Contagion Model

To read that formula you’d guess — correctly — that the users range is in row 7, contagion rate is dell B3, and population is cell B2. I enclose that basic formula inside a rounding function that rounds results to whole people, rather than portions of people. That turns my formula into:

=round((users*contagion rate)*((population-users)/population),0)

… which is what you see in the illustration above.

As you can probably guess, the users calculation in row 6 of the spreadsheet adds the beginning of the month users total to the new users to calculate the beginning-of-month total for the next month. So the 23 users in cell E6 is the sum of the 17 users in cell D6 plus the 6 new users in cell D7. For that formula I use a MIN function to make sure I don’t accidentally project more users than total population. The actual formula for cell E6 is:

=MIN(D6+E6,population)

So what’s the use of all this spreadsheet detail? First, because it gives a forecast some meaningful assumptions you can explain to an interested party, substituting a natural phenomenon for SWAG (scientific wild-assed guess). Second, because sometimes it works. One of the most accurate forecasts I ever did was a projection of personal computer usage in Latin America in the 1980s. I assumed four economic strata, so four different population groups, each of which had different contagion rates and total populations. They were basically the urban wealthy, the middle class, and the rest of the population. I did a five-year forecast that my clients checked five years later, and I had predicted the total, on a five-year time frame, to within five percent of what actually happened. That was quite a coup, and it still makes me happy many years later.

Final note: I’m enjoying all the possible contradiction between this post and my last post, make my analysis intuitive please. I’m not offering any excuses for it either. Except, maybe, the beauty of a natural curve.

5 Steps to Better Financial Projections

(Note: this is reposted from my post Monday on Amex OPEN forum. It had a different illustration there, and I’ve changed it to the hockey stick here in honor of so many sales forecast charts that looked like hockey sticks)

Every spring, I read and review dozens of business plans as a member of an angel investment group and a judge at several business plan contests. I love it. The plans I’ve seen are better than ever this year. But, for some reason, their financial projections are the worst I’ve seen.

How can the plans be better while their financials are worse? I think product/market fit, defensibility, scalability, market need and management experience are much harder to fix than bad financials. A good business with poor financial projections will survive and grow.

Still, it’s a damn shame. The worst, and by far the most common mistake, is absurdly high profitability. So, in honor of this epidemic of bad financials, here’s my five-step plan for better financial projections.

1. Start with a sales forecast

Make it bottoms-up, always; never tops-down. This means that you start with unit and price details and build up to sales from specific, concrete assumptions. For example, if it’s a website, base your forecast on metrics you and others can compare to other websites, such as unique visits, page views and conversions. If it’s a product going through distributors to retail stores, then look at the number of stores you can reach and the distributors required to reach them, and forecast units per store per month.

Never get caught forecasting a market by assuming the total market size and then projecting your market share. That doesn’t work. Nobody who matters believes it.

Do it monthly for 12 months, then annually for the second and third year. Think of it as a spreadsheet with months and years horizontally across the top and category names vertically along the left-hand side.

Your sales forecast should include your direct costs (also called unit costs) and costs of goods sold (or COGS). This is how much it costs you in direct costs, unit costs, per units sold. These are costs you don’t pay if you don’t sell. They go up and down as sales go up and down.

If you have no idea, don’t throw your arms up in frustration; don’t say “but it’s a new business, how could I know?” Break it into unit economics and unit assumptions. Get some comparisons from similar industries to show you what gross margin (sales less costs of sales) might be, and average profitability. Google “standard financial ratios” for leads, and don’t expect to pay more than $100 for one industry profile.

And if you still have no idea, then: 1. keep your day job; or 2. find some partners who know the industry.

2. Forecast running expenses

We call these operating expenses, such as rent, utilities, payroll, advertising, websites, travel and so forth. Here again, if you have no idea, you need to find financial profiles, take in a partner, talk to somebody who’s done it before, or maybe keep your day job. You don’t want to have no idea.

This is also a spreadsheet, with the same months and years as in the Sales Forecast horizontally across the top, and the categories vertically down the left side.

By the time you’re done with expenses, you’ve got everything you need to do an estimated profit or loss analysis. The standard format starts with sales, then subtracts direct costs to calculate gross margin. Then you subtract operating expenses to calculate profit before interest and taxes (called EBIT, with the E standing for “earnings.”)

If your projections have profits higher than 10 or so percent of sales, you’re not done. Either you have underestimated your costs or expenses, or you have an unusually strong business. It’s almost always the former.

Hint: No matter what industry you’re in, if your pretax profits are more than 15 percent, then I suggest you subtract 15 percent from your projected profits and add that amount back into operating expenses as marketing expense. Having profits too high usually means you aren’t projecting all your expenses. And marketing is where most people underestimate expenses. And besides, in a real business, well-spent marketing expenses are better than profits because they grow your business, which makes it more valuable over the long term.

3. Startup costs

Make a list of expenses you’ll have to pay before you start. Common startup expenses are legal expenses, website development, logos, signage, fixing up a location, computers and so on. Then make a list of assets you’ll need. Those are things like vehicles, equipment, furniture, startup inventory and starting cash in the bank.

The cash in the bank is the toughest. If you go back and look at your running profit and loss, that will give you an idea. You have to have money to support your early losses. Read the next step and then revisit it.

4. Understand cash flow

Unfortunately, making a profit doesn’t mean you have cash in the bank. The biggest problems here are the business-to-business sales, which typically mean you get paid a month later; and product businesses, because normally they have to buy things to sell before they sell them. If you’re a business that paid two months ago for what you sell today, and is going to get paid for that three months from now, then cash flow is both critical and unintuitive. You’re going to need money in the bank (you can call that working capital) to handle running expenses while you wait to sell stuff and get paid for it.

On the other hand, If you’re selling to people who pay immediately in cash, check, or credit card, especially if you’re not putting money into buying and keeping products, then cash flow is more predictable.

If you have no idea, and you do have business-to-business sales and inventory, then look at templates, or software, or books, or tutorials, or somebody who can help you. Don’t take cash flow for granted, even if you expect to be profitable. Ironically, some of the worst cash-flow problems come with high growth rates.

5. Review and revise regularly

Yes, you should forecast for 12 months and the two following years; but no, don’t expect your forecast to be accurate. They never are. You do the financial forecasts so you can set expectations and link spending to sales, but that’s just the start. Review your results every month. Compare actual results to what you had planned. And make corrections.

Final thought: all financial projections are wrong, by definition. We’re human and we don’t predict the future accurately. So don’t expect accuracy. Go for plausibility, and then follow up with regular plan versus actual analysis, review and revisions. We call that management.

(Image: Nicolas McComber/Shutterstock)

Big Mistake: Business Plans And Investor Returns

Another problem that comes up a lot as I read on with my business plan marathon: too many business plans are taking too much time and effort telling supposed investors what their supposed return on investment will be. This is usually a waste of time, energy, and space. It’s certainly a mismatch between what the entrepreneurs are thinking and what the investors are thinking.

fool's goldI was surprised a couple days ago, talking to entrepreneurs, at how much emphasis they put on wanting to know what return on investment was satisfactory to investors. It was as if they thought what the plan says the company will be worth five years from now makes a difference. And it doesn’t. The illustration here is a piece of fool’s gold, iron pyrite.

It felt like these entrepreneurs are thinking: investors want to see X in returns so I have to show that in my plan. I pop up the sales forecast, pop up the profitability, and that generates a great projected valuation. So I show that I can deliver a great return.

Investors, meanwhile, are actually thinking: I want to look at the product-market fit, scalability, management team, and factors like that to determine whether the company is going to make it. If they have all that right, then they have a shot; and if not, they don’t. Projected investor returns depend on a future valuation, which depends on the sales forecast or income forecast or both. Most investors look hard at the sales and profitability projections, because they want to see credibility; I use them to get a feel for how well the entrepreneurs know the business. There’s so much cascading uncertainty on future valuation that I don’t put much stock in it.

There’s a Catch-22 about sales and profitability forecasts: credibility of the numbers means more than the numbers themselves. A plan that has both big numbers and credibility is rare.

(Image: Vakhrushev Pavel/Shutterstock)

Why I Hate Those Huge Market Numbers

It happens way too often: entrepreneurs proud of some huge completely unattainable market numbers. They show us billions of dollars. They think that’s a good thing, like it’s important. I hate it.

As an investor, as a business plan contest judge, or as a teacher, I don’t really care how many billions of dollars are spent on this or that or the next thing when I’m reading a business plan. That number is too big. It tells me nothing. Startups don’t reach multi-billion dollar markets.

If it makes you feel better to give me that number in passing, okay, go ahead, but don’t put any emphasis on it. Instead, give me the details on how you’re going to make your sales, and to whom, on the first day, the first quarter, and the first year. Give me granularity.

If you’re a Web-based startup, for example, show me how many unique visitors you think you can get in the beginning, and what you’re using for an estimated conversion rate (buyers to browsers). Show me how much each unique visitor is going to cost you in search engine optimization and pay-per-click search engine expense.

If you’re a restaurant, for example, show me how many chairs and tables lead to what assumptions for first-day, first-month, and first-year meals served, drinks served, and at what average price. Show me how you’re going to bring those people in the door.

I guess what this means is that I like forecasts that build from the details up to the larger numbers.

And I know that I’m in the majority, among people who read business plans, in really disliking the top-down, billions and billions kind of forecasts. When they start talking about getting only a very small percentage of an enormous market, they lose me. Those huge markets don’t split down into millions of pieces.